Axpo in Singapore Shaping a climate-friendly future
About us
Founded in 2020 in Singapore - one of the world’s key hubs for energy trading - as a merchant trading business, Axpo Singapore has developed a cross-commodities expertise covering LNG, LPG, natural gas and power across the Asia-Pacific (APAC) region.
We leverage our leading-edge analytics and deep understanding of market dynamics to provide comprehensive solutions tailored to our customers’ energy procurement and risk management needs. From our office in Singapore, we serve power customers in Japan, New Zealand, and Australia. For remaining products – LNG and LPG – can deliver cargoes anywhere in Asia-Pacific.
To contact the team in Singapore, please send an email to info.sg@axpo.com
Energy Solutions
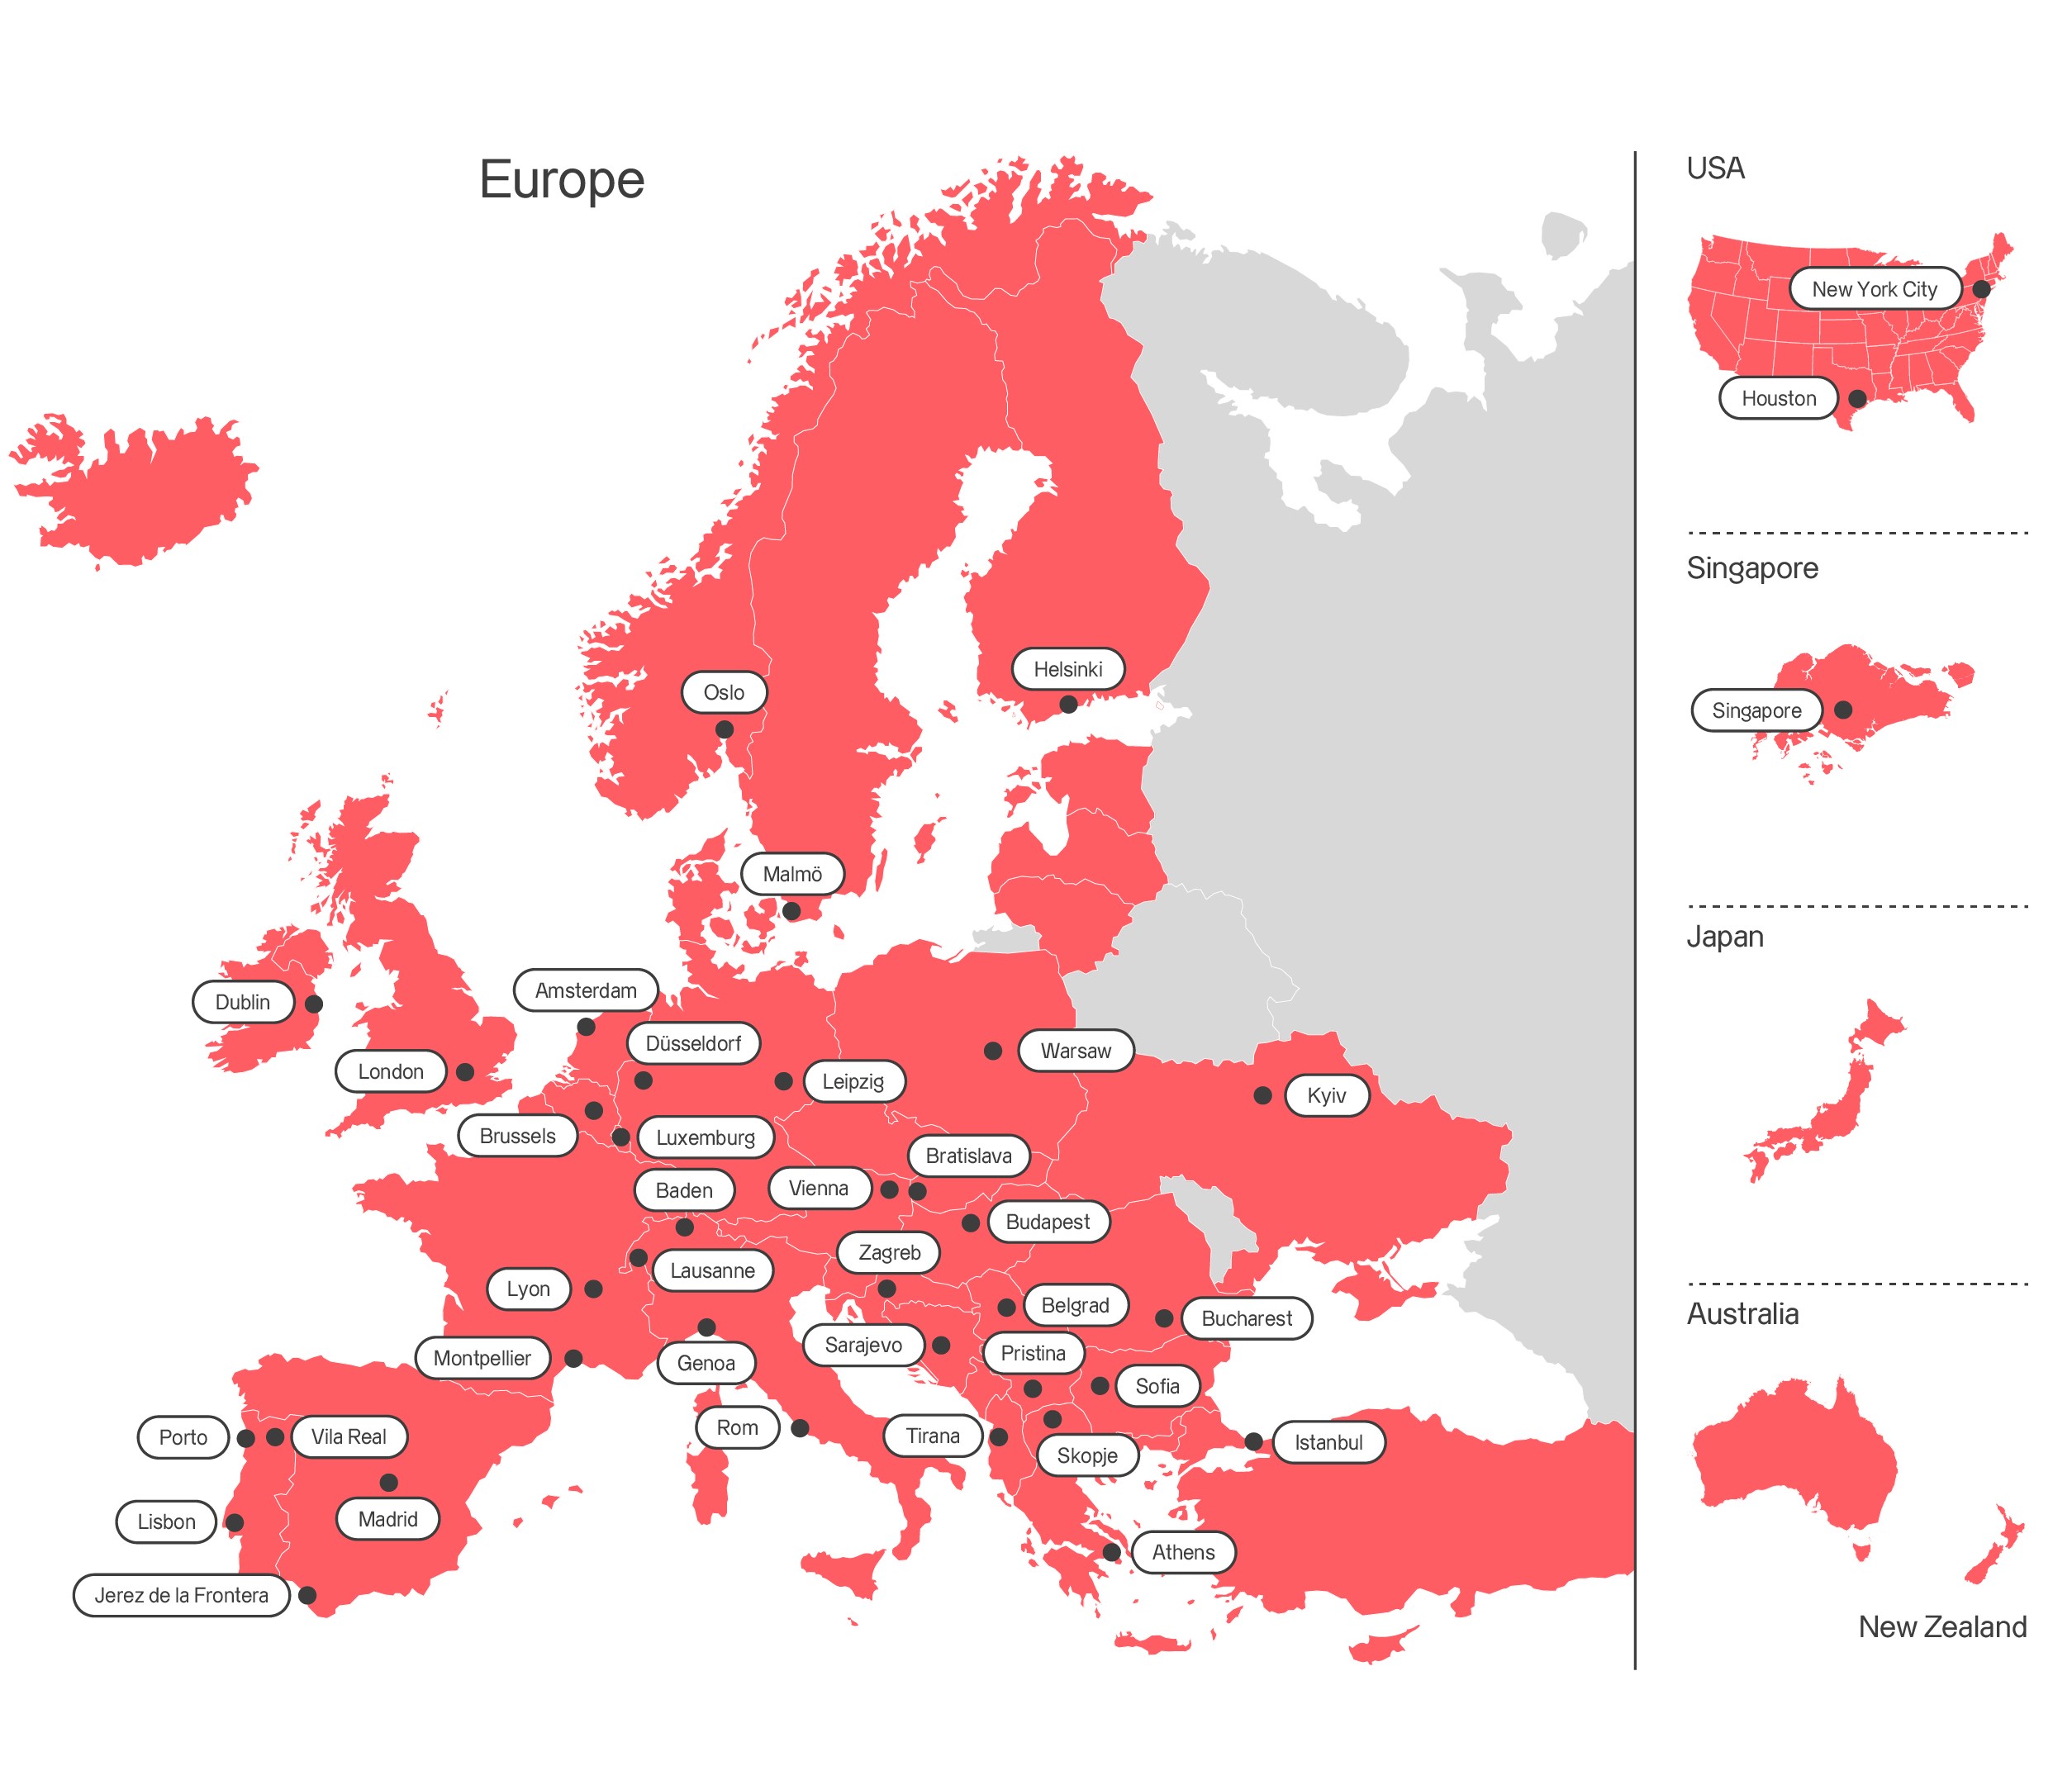
Axpo is driven by a single purpose – to enable a sustainable future by providing innovative energy solutions. Axpo is Switzerland's largest power producer and an international leader in energy trading and the marketing of solar and wind power. Axpo combines the experience and expertise of more than 7,000 employees who are driven by a passion for innovation, collaboration and impactful change. Using cutting-edge technologies, Axpo innovates to meet the evolving needs of its customers in over 30 countries across Europe, North America and Asia.

Power
Axpo offers a wide range of products and services tailored to meet your electricity needs. Customers benefit from Axpo's proven experience in energy optimisation, risk management and market analysis, as well as our Europe-wide presence. Your organisation’s consumption behaviour, appetite for price and quantity related risk, even the time available to spend on your project, can all influence the choice of procurement model. Axpo customers benefit from our comprehensive product portfolio, which offers both standard products and tailored energy solutions optimised to best manage your risk.

Natural gas
Natural fluctuations in energy consumption and volatile prices present market participants with major challenges. Axpo offers a wide range of products and services that can be tailored to meet your energy needs. Our customers also benefit from Axpo's proven experience in energy trading, risk management and market analysis, as well as our growing international presence. Your consumption behaviour, willingness to take risks in terms of price and quantity, even the time available to devote to your project, all influence the choice of procurement model. Axpo customers benefit from our comprehensive portfolio, which offers both standard products and tailored energy solutions.

LNG & LPG
Axpo in Singapore is active in the trading and management of LNG & LPG related businesses, including but not limited to the physical deliveries of LNG cargoes around the Far East regions, but also providing risk management solutions which is a very important aspect of our business. For over 5 years, we have been actively delivering LNG & LPG solutions across Asia-Pacific. We are onboarded with majority of the trade houses, brokers, energy majors and utilities, NOCs and aim to provide the most wholesome and integrated experience to our customers.
Jobs & Careers
At Axpo, you'll find a dynamic environment driven by innovation, sustainability, and diverse career paths. With over 150 different employment profiles, we offer opportunities for professionals, students, graduates, and apprentices to thrive.
-
Diverse career opportunities
Explore a wide range of roles that match your passions and skills.
-
Commitment to sustainability
Contribute to a greener future through cutting-edge, climate-friendly energy solutions.
-
Focus on innovation
Be part of a culture that values rapid experimentation and progress in the global energy sector.
Internships
Axpo Singapore regularly offers internships for motivated individuals eager to grow and contribute. If you're interested in joining our team as an intern, please send your CV and a short cover letter to info.sg@axpo.com.
Contact
We appreciate your interest in Axpo and are here to help. Please complete the contact form and our team will respond promptly to your inquiry.