


Axpo Romania Who we are and what we do
Axpo Energy Romania is one of the subsidiaries of the century-old Axpo Group, the largest Swiss producer of renewable energy and a global leader in solar and wind energy trading and sales. For over two decades, we’ve been developing energy products and services tailored to our customers' needs.

About Axpo in Romania
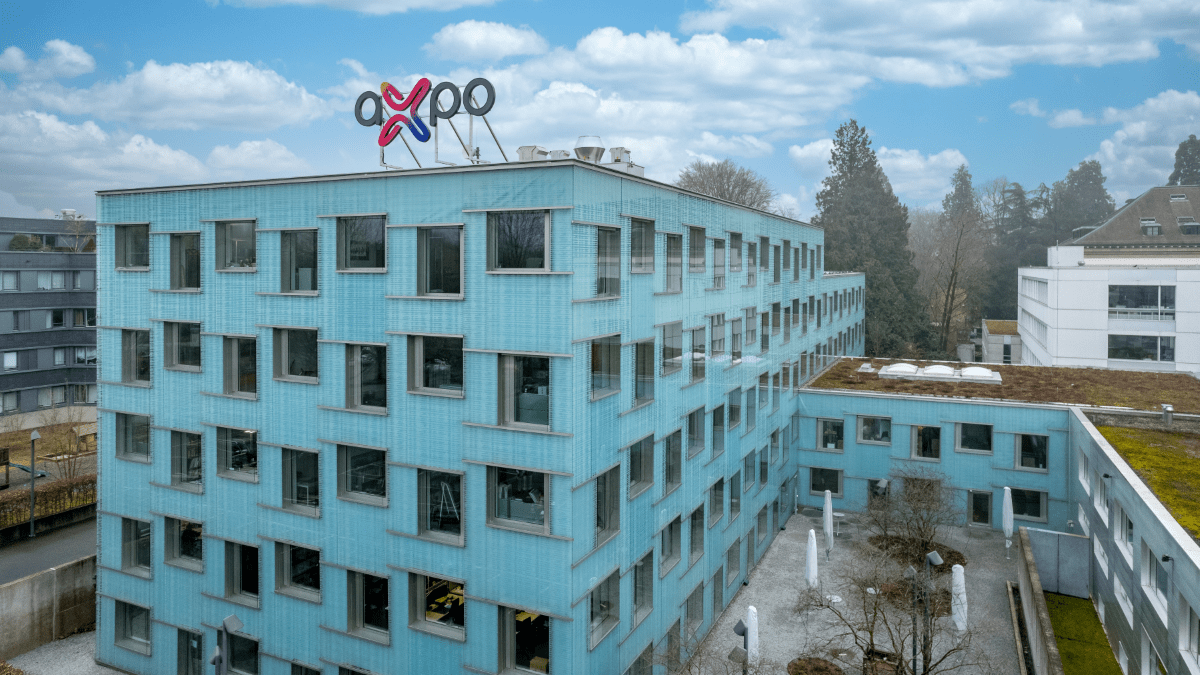
We are part of the Swiss Axpo Group, whose origins date back to the late 19th century. The group consists of Axpo Holding AG and its subsidiaries. Axpo Holding AG is headquartered in Baden, Switzerland, and is wholly owned by the northeastern Swiss cantons, making it 100% publicly owned. The group has over 7,000 employees, operates more than 100 power plants across Switzerland, and is present in over 30 countries across Europe, North America, and Asia.

Axpo Energy Romania
Axpo Energy Romania has been based in Bucharest since 2003 and offers a wide range of expertise in power and gas full supply, energy trading and green certificates. It is one of the main players on the Romanian energy market.
Axpo Renewable Romania
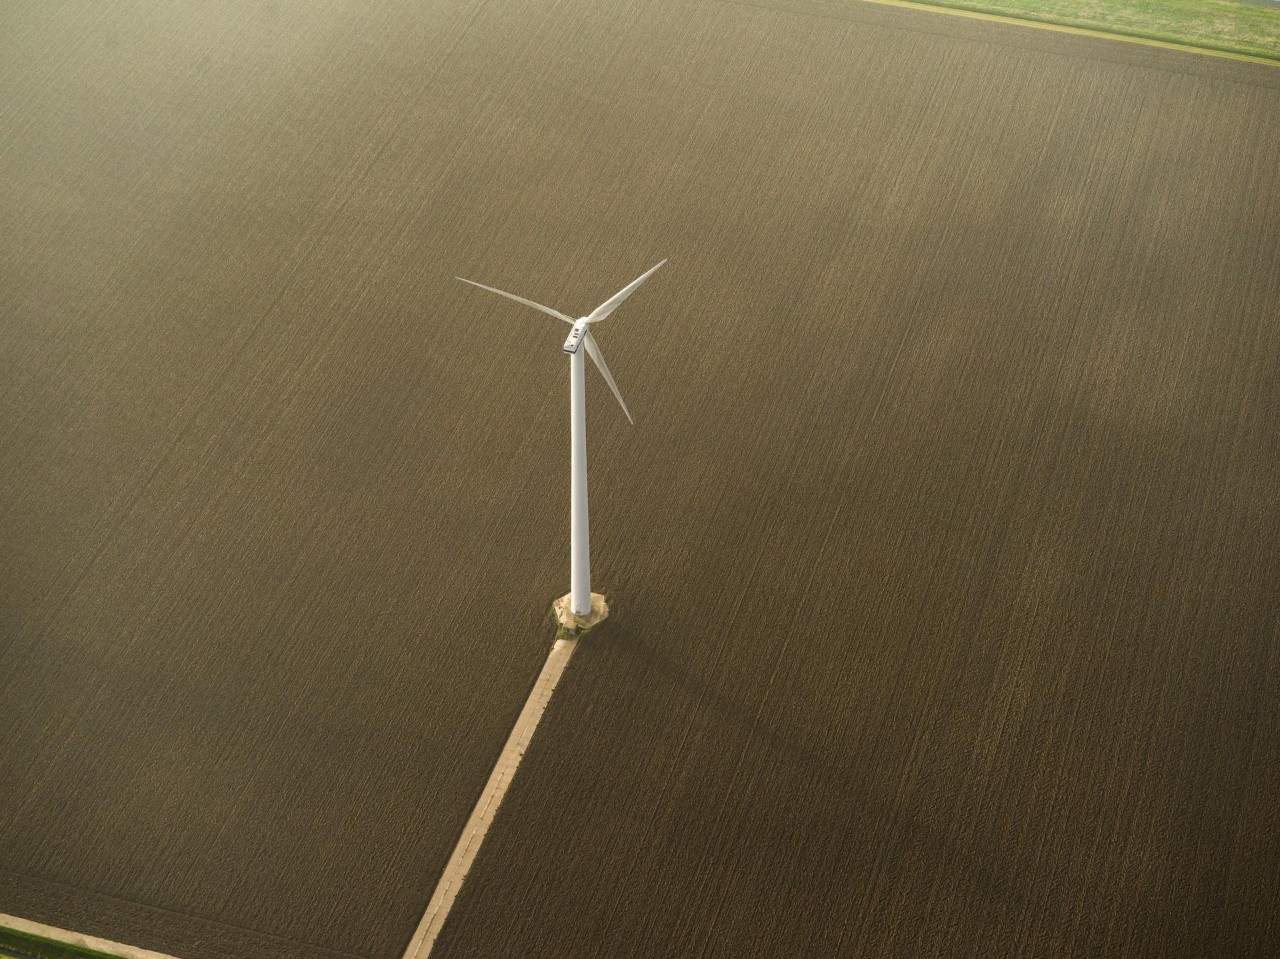
Axpo Renewable Romania, founded in 2022, develops onshore wind and battery storage projects locally and in the region. It supports Axpo’s goal of adding 3 GW of renewable capacity in Europe and contributes to advancing clean energy infrastructure.
Axpo Services Cluj
Axpo Services Cluj S.R.L., opened in 2024, delivers engineering, data analysis, project management, finance, procurement, and HR services. Based in Cluj-Napoca, it supports Axpo’s international operations with key business functions.

.png.png)

.png.png)