.jpg)


Axpo in Germany Specialized in trade and distribution
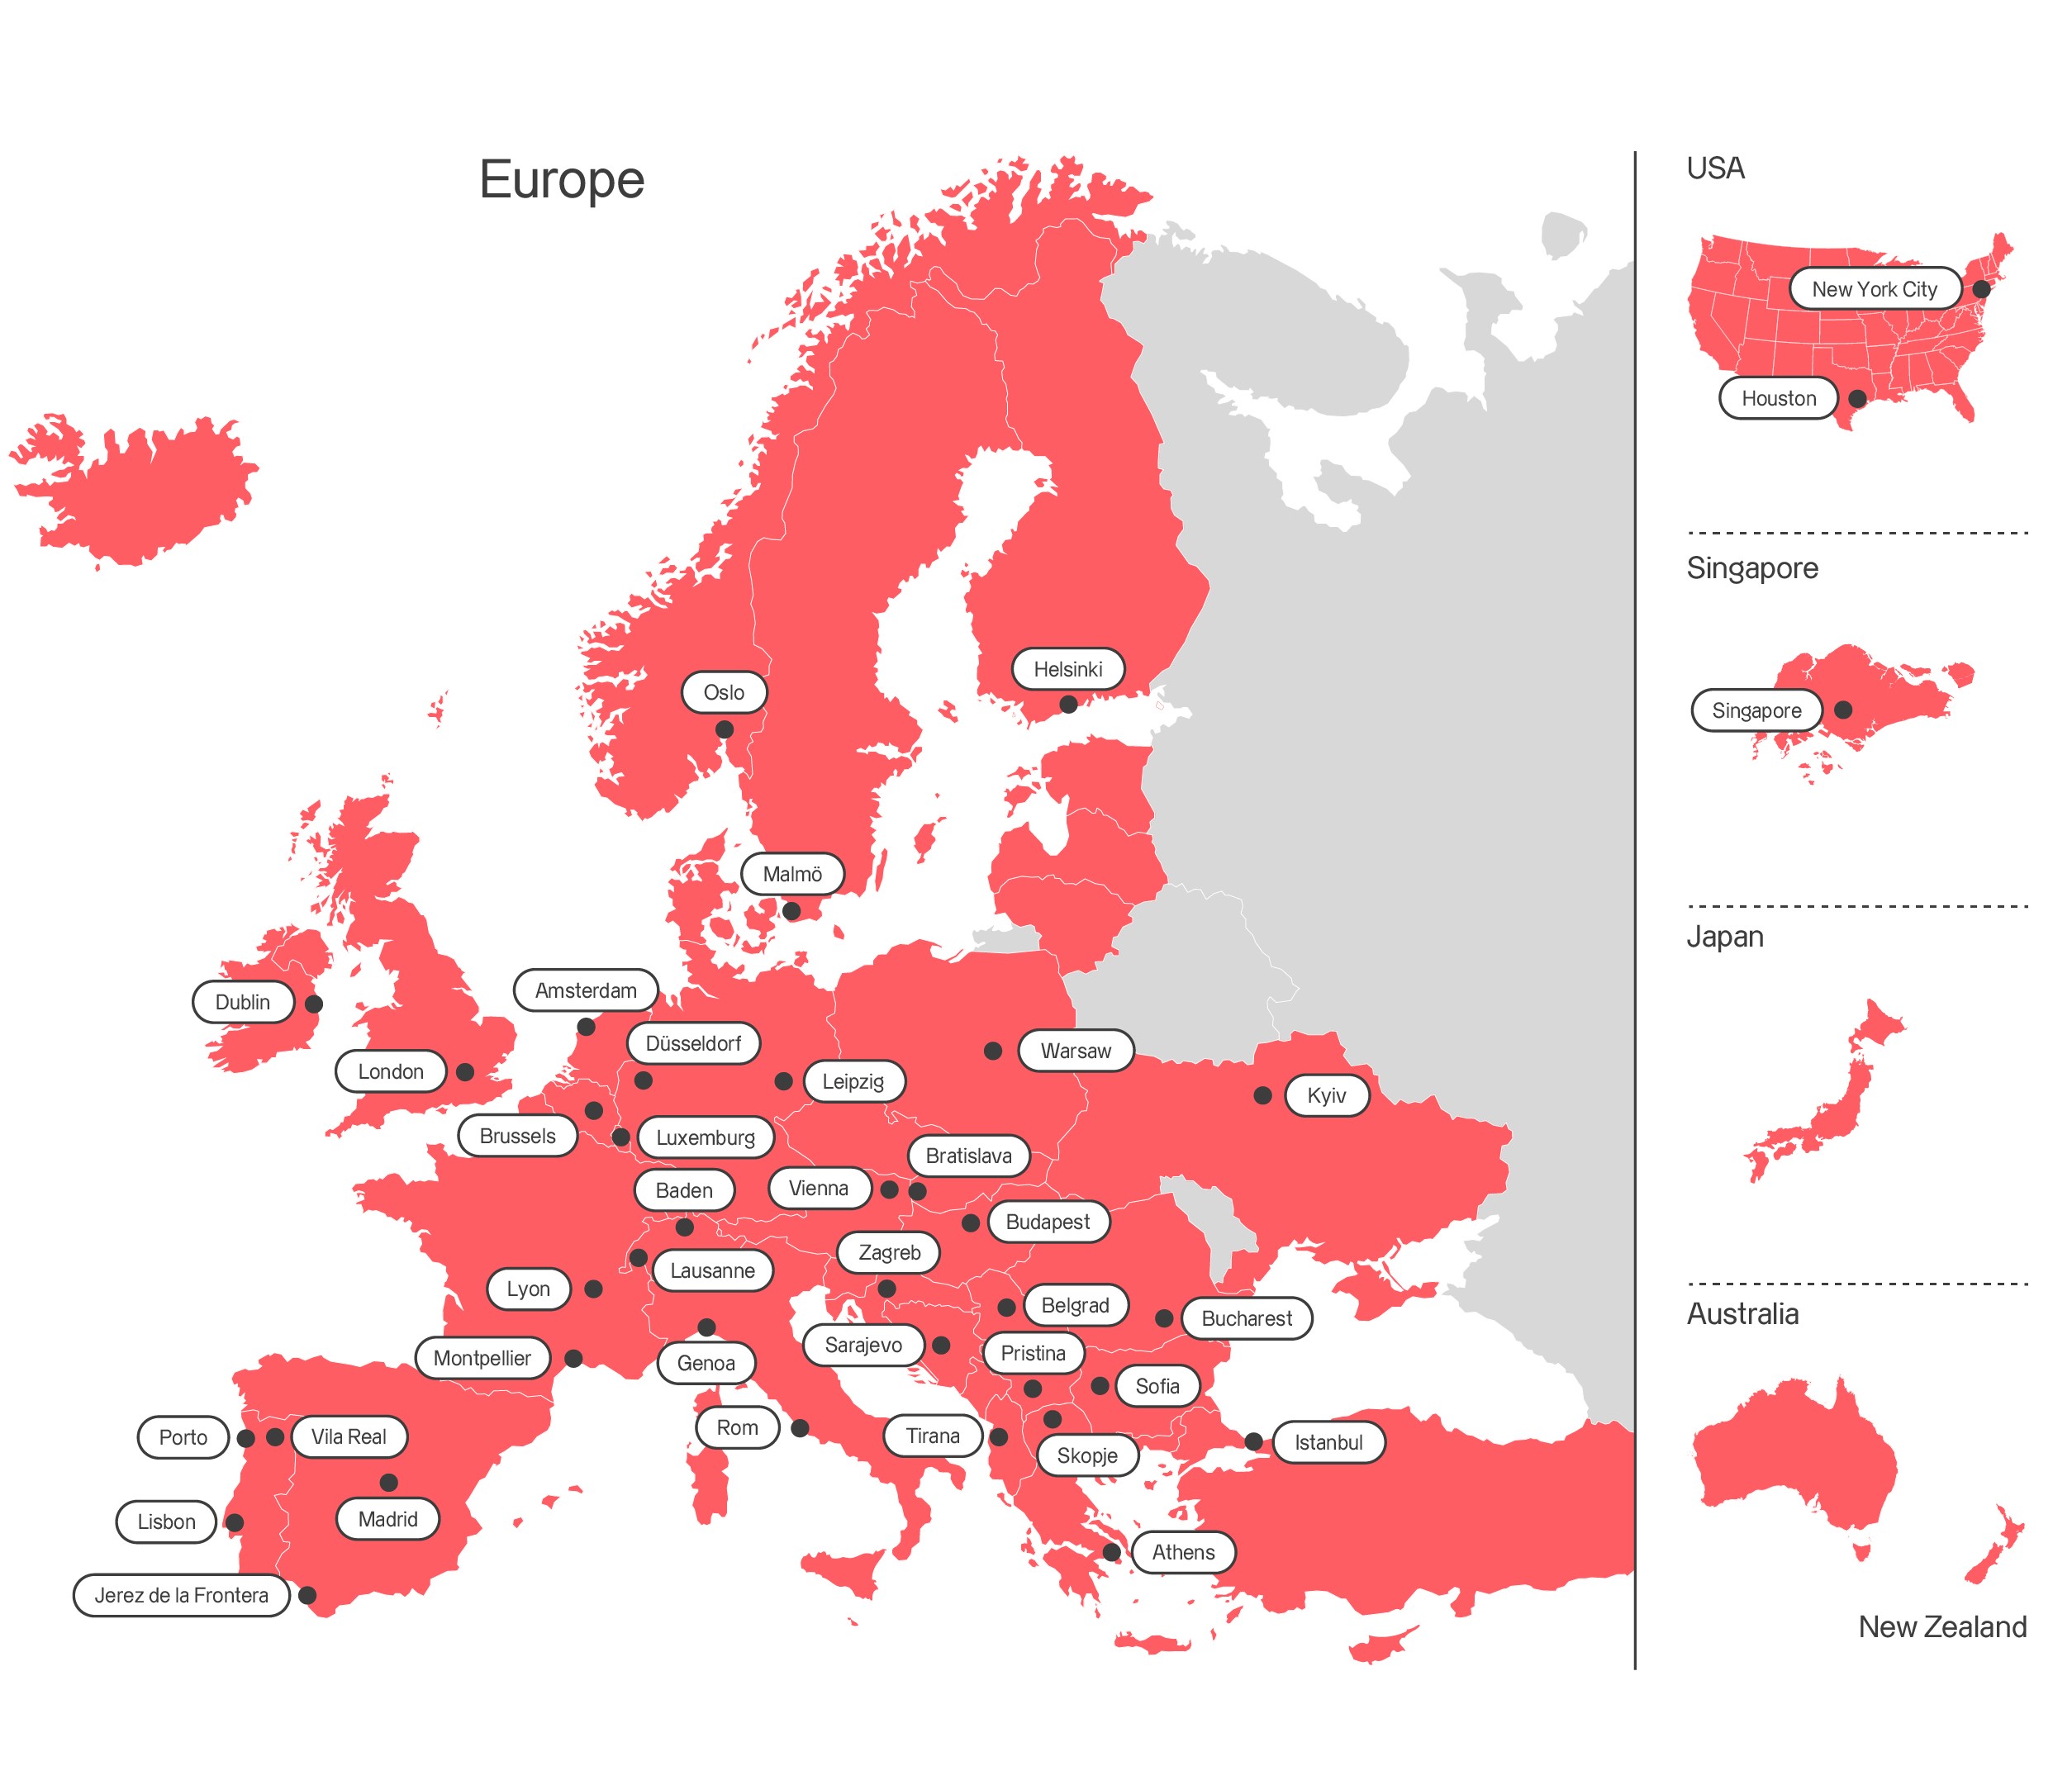
Axpo Deutschland GmbH has been active on the German energy market since 2003 and is part of Axpo Holding AG, which is headquartered in Switzerland.
Axpo is active in the production, distribution and sale of electricity as well as in international energy trading. Axpo also offers innovative energy services for customers in Switzerland and Europe.
In Germany, Axpo specializes in the trading and distribution of energy. From our branches in Leipzig and Düsseldorf, we offer resellers, industrial companies and power plant operators individual products and services in the following areas:
-
Supply of electricity
-
Supply of gas
-
Origination (structured products and trading)
-
PPAs (Power Purchase Agreements) - both as a buyer of electricity and as a supplier to consumers (corporate PPAs, green electricity supply)
-
Direct marketing of renewable energy plants
-
Long-term price hedging
-
Flexibility marketing
-
Portfolio and balancing group management
-
Market access for electricity and gas (intraday, spot and forward market)
-
Procurement of CO₂ and green certificates (guarantees of origin)
-
Energy-related services
Axpo Deutschland GmbH is certified according to ISO27001.
- ISO27001 Certificate View Send email Download
Get in contact with us
Johannes Pretel, Managing Director
You can find us here
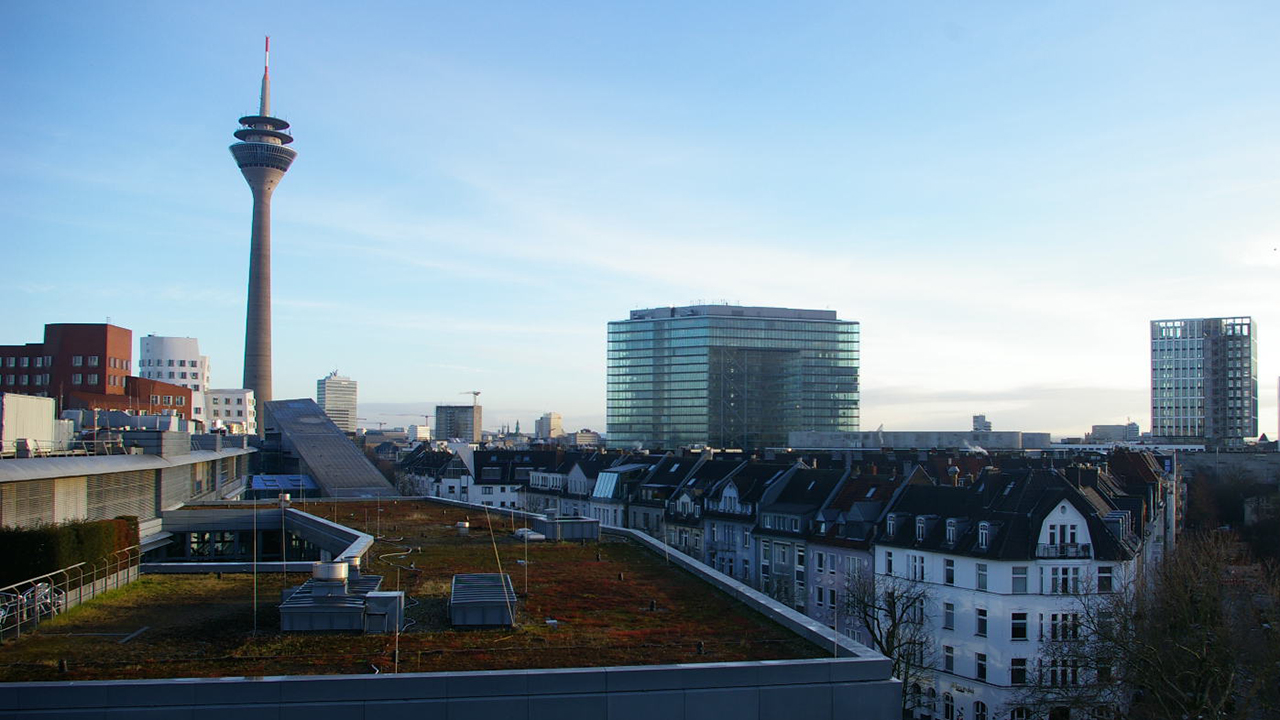
Location Düsseldorf
Axpo Deutschland GmbH
Karl-Arnold-Platz 2
DE-40474 Düsseldorf
+49 (0) 211 416 146 0
Location Leipzig
Axpo Deutschland GmbH
Messehaus am Markt - Markt 16
DE-04109 Leipzig
+49 (0) 341 261 79 0
Axpo Group
Axpo is driven by a single purpose – to enable a sustainable future by providing innovative energy solutions. Axpo is Switzerland's largest power producer and an international leader in energy trading and the marketing of solar and wind power.