Axpo in Albania | Kosovo Shaping a climate-friendly future
About Us
Axpo Albania sh.a has been a key player in the country’s energy sector since 2005. Focused on power trading, the company collaborates with numerous partners in the Albanian energy market, including state-owned KESH, its largest power producer. Axpo Albania sh.a is a member of the Albanian Power Exchange (ALPEX) and is committed to actively participating in the day-ahead market on an ongoing basis. Our Managing Director Kenan Karamehmedovic and Country Manager Evis Puka would be glad to hear about your energy needs.
Powering the future with global expertise and innovation
Employees
Years of experience
Countries
Energy Solutions
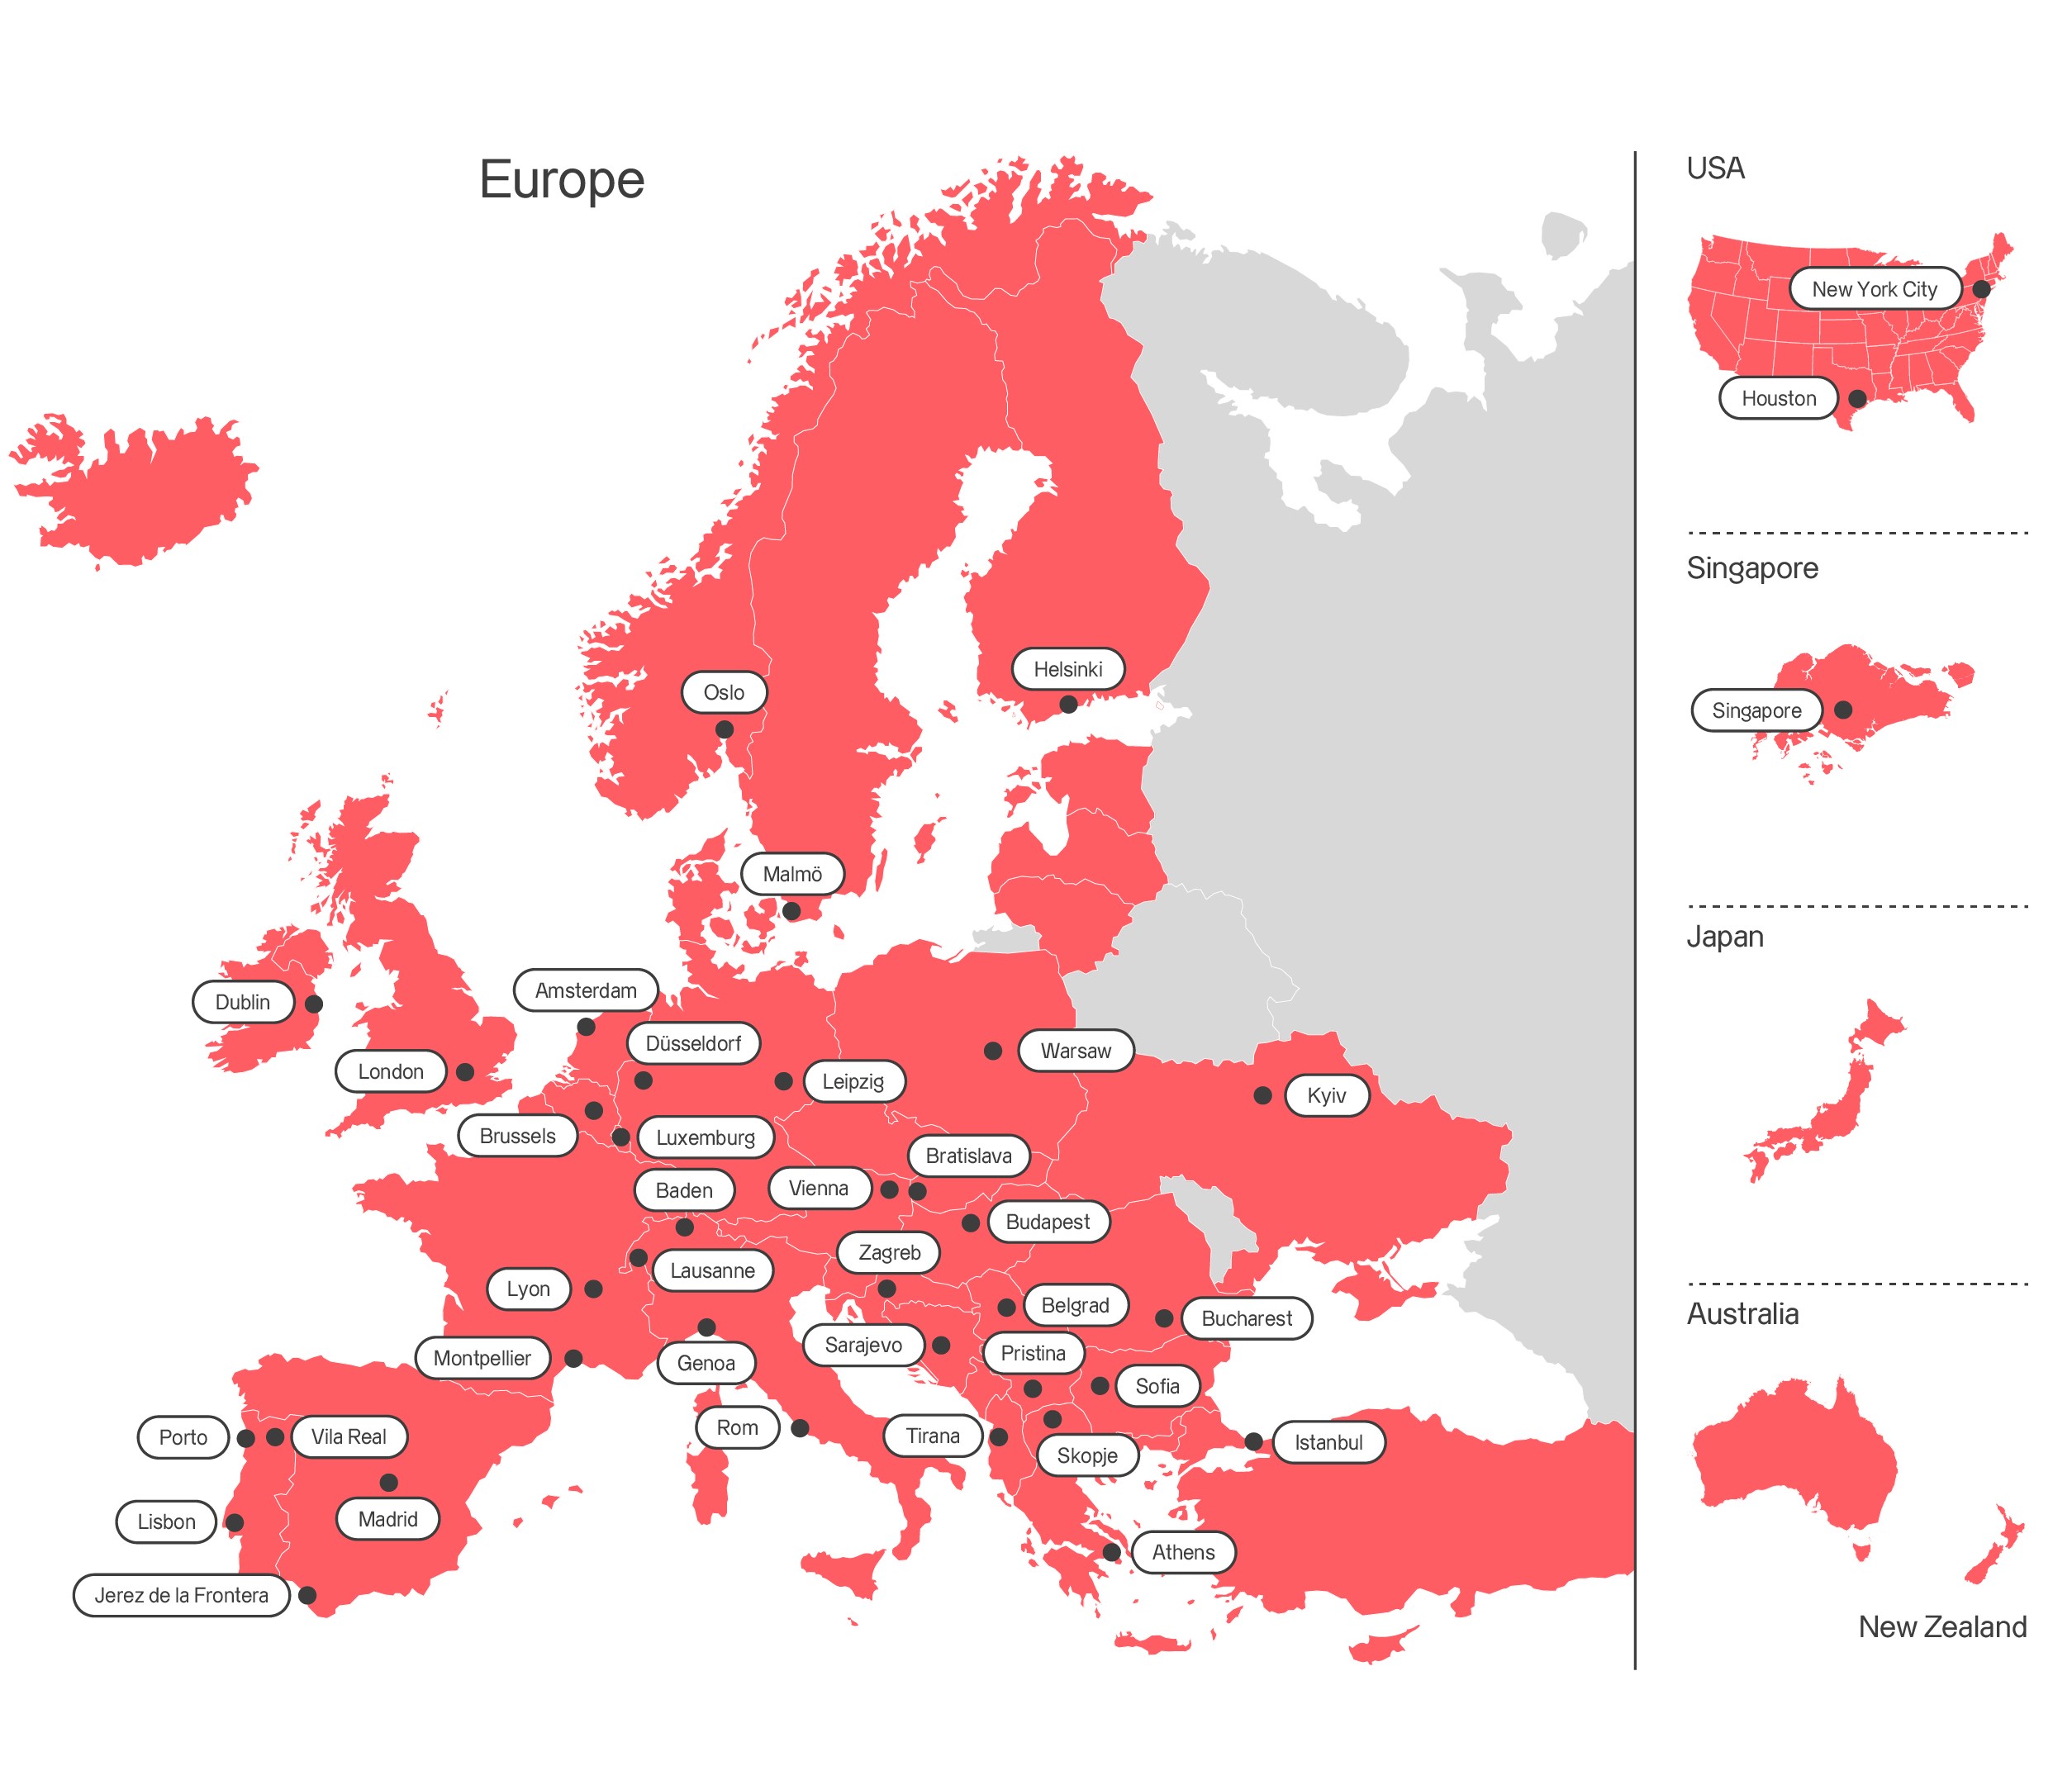
Axpo is driven by a single purpose – to enable a sustainable future by providing innovative energy solutions. Axpo is Switzerland's largest power producer and an international leader in energy trading and the marketing of solar and wind power. Axpo combines the experience and expertise of more than 7,000 employees who are driven by a passion for innovation, collaboration and impactful change. Using cutting-edge technologies, Axpo innovates to meet the evolving needs of its customers in over 30 countries across Europe, North America and Asia.
Power
Axpo offers a wide range of products and services tailored to meet your electricity needs. Customers benefit from Axpo's proven experience in energy optimisation, risk management and market analysis, as well as our Europe-wide presence. Your organisation’s consumption behaviour, appetite for price and quantity related risk, even the time available to spend on your project, can all influence the choice of procurement model. Axpo customers benefit from our comprehensive product portfolio, which offers both standard products and tailored energy solutions optimised to best manage your risk.

Natural gas
Natural fluctuations in energy consumption and volatile prices present market participants with major challenges. Axpo offers a wide range of products and services that can be tailored to meet your energy needs. Our customers also benefit from Axpo's proven experience in energy trading, risk management and market analysis, as well as our growing international presence. Your consumption behaviour, willingness to take risks in terms of price and quantity, even the time available to devote to your project, all influence the choice of procurement model. Axpo customers benefit from our comprehensive portfolio, which offers both standard products and tailored energy solutions.

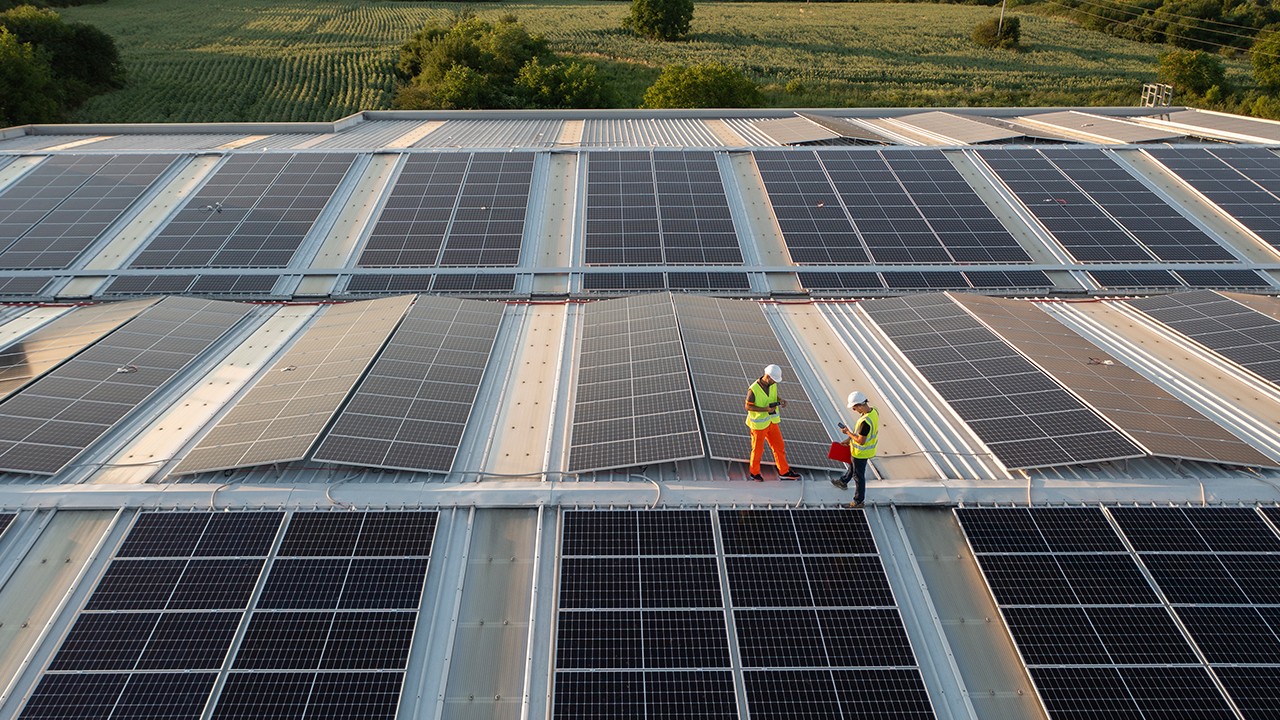
PPAs
Axpo is at the forefront of the international power purchase agreement (PPA) business, offering tailored on and off-site solutions for green electricity procurement that meet the specific requirements of our customers. As the demand for 100% renewable energy increases, industrial customers are increasingly adopting this standard way of financing. Long-term PPAs have emerged as a crucial tool to support the energy transition in the renewable energy sector. Following the reduction or elimination of state subsidies and sharply falling production costs for new green power plants, renewable energy PPAs have become a major trend in many parts of Europe. They enable the development of new green electricity generation without relying on subsidies, help power the energy transition, and support the fight against climate change.
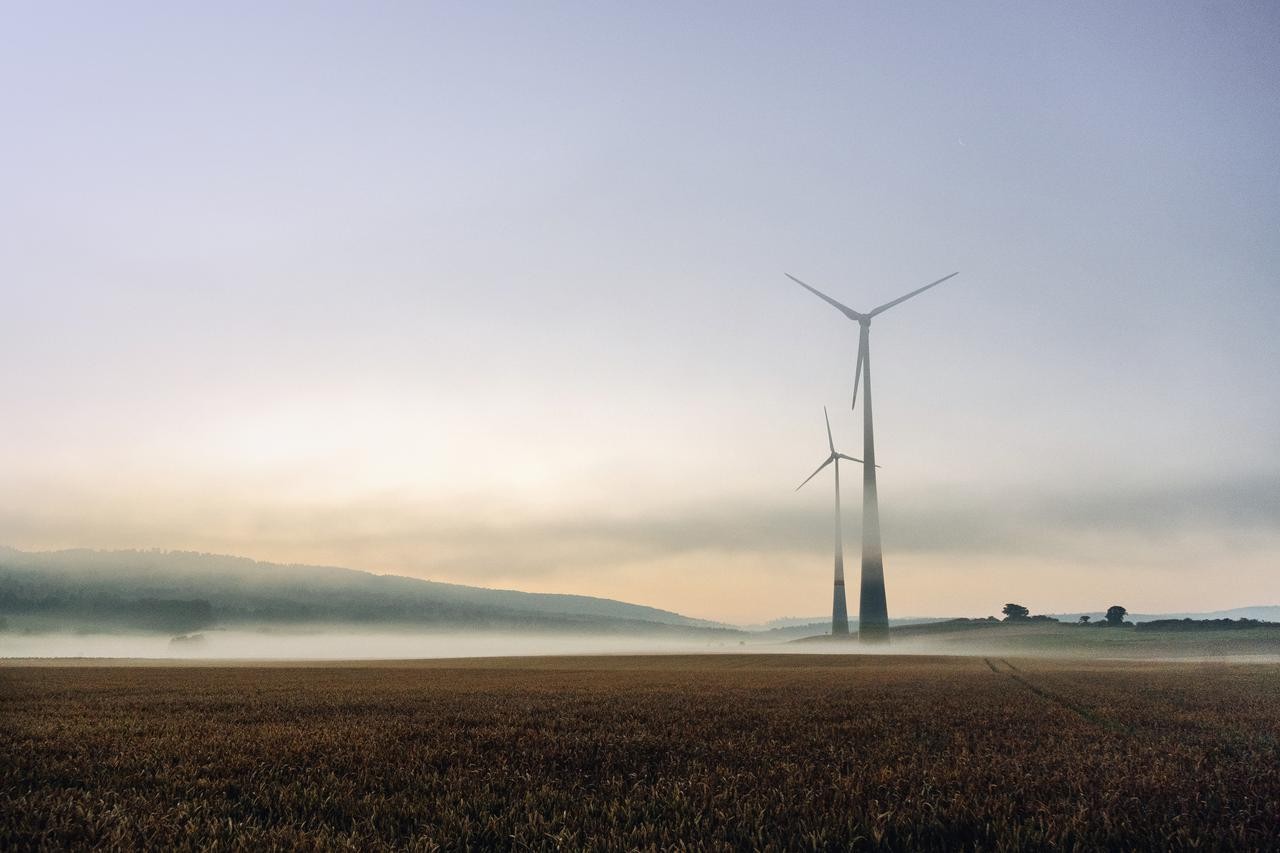
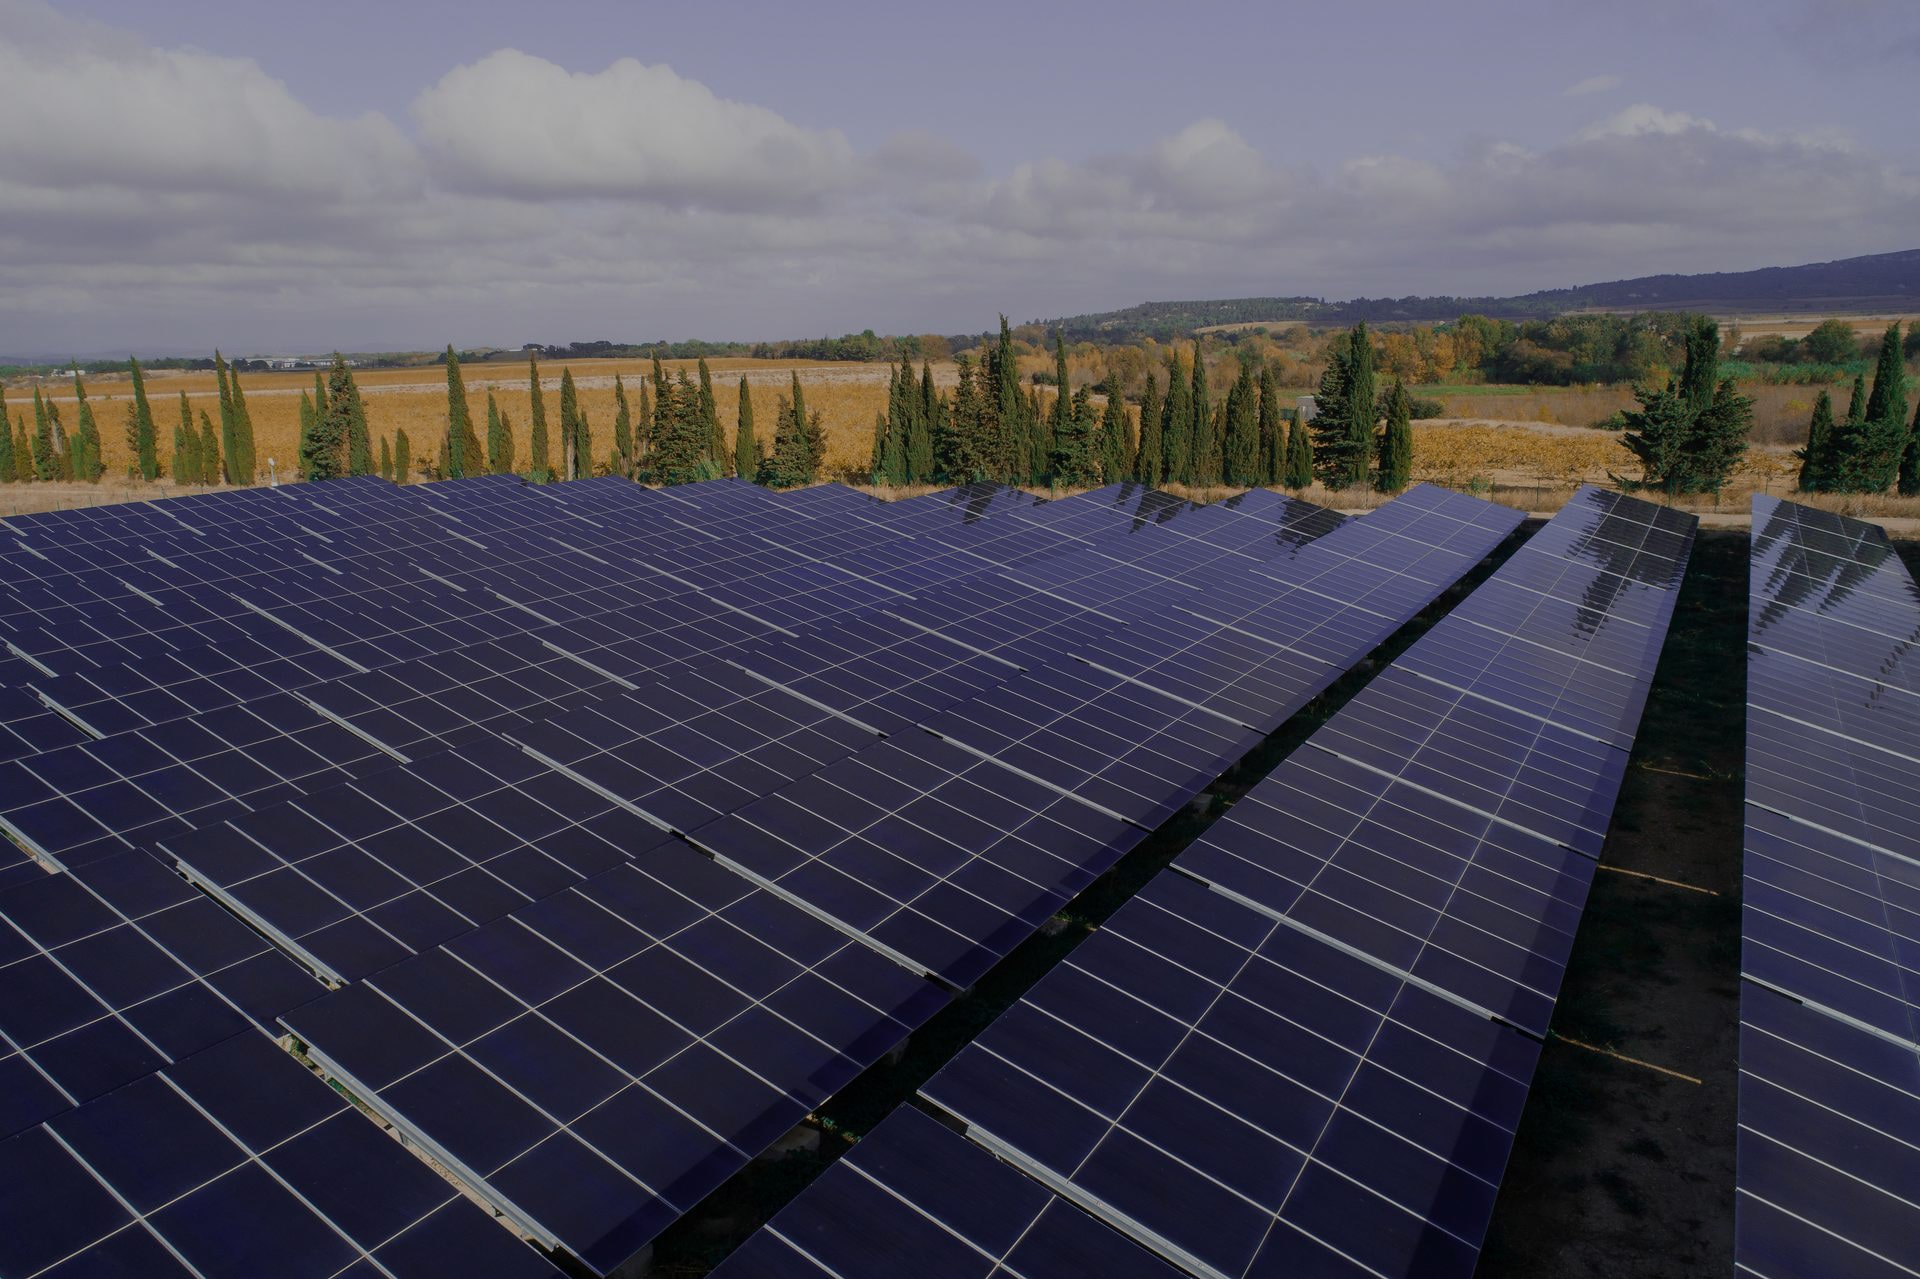
Renewable energies
Axpo offers a comprehensive range of green electricity products from different renewable energy sources. With our diverse portfolio of technologies, including hydropower, biomass, wind, and solar, Axpo offers a range of regional and individual renewable energy solutions to energy suppliers, including the provision of certificates of origin and quality labels. With the direct marketing of renewable energies, Axpo provides additional revenue, long-term investment security, and freedom from administrative and operational costs.

Market access
Axpo customers gain access to every power exchange and can trade across various maturity periods, both physical and financial, for structured options, standard products and OTC transactions. Whether an upstream producer or participant in the mid- to downstream energy sector, customers benefit from our strong presence across all major European power markets. Over the years we have acquired significant physical and financial risk management and trading expertise. Customers and counterparties regularly acknowledge the quality of our services in the Energy Risk Commodity Rankings.

Guarantees of origin
Organisations wishing to add environmental value to their electricity purchases can benefit from our comprehensive range of guarantees of origin (GOs) and green electricity products. These cover various technologies, energy sources and labels and are all compliant with current legislation and the international European Energy Certificate System (EECS) standard. Customers can choose GOs from Axpo’s large portfolio of hydropower plants in the Swiss Alps and rivers or from solar, wind, biomass and nuclear energy facilities in Switzerland and Europe.
Get in touch with us
We appreciate your interest in Axpo and are here to help. Please complete the contact form and our team will respond promptly to your inquiry.


Jobs & Careers
-
Diverse career opportunities
Axpo offers more than 150 different employment profiles, providing a wide range of career paths for professionals, students, graduates, and apprentices.
-
Commitment to sustainability
Axpo employees contribute to building a sustainable future through innovative and climate-friendly energy solutions.
-
Focus on innovation
Axpo prioritises the rapid testing and validation of innovative projects, fostering a culture of progress and collaboration in the global energy sector.